San Pedro Real Estate Market Update
Market Report for the Month of October, 2018
The below will provide market data, obtained from the California Regional Multiple Listings Service, in order to further understand the trends of our current Real Estate Market in San Pedro and the South Bay Community. Data that has been obtained and detailed is intended to be reliable, but is not guaranteed to be so.
Data has been compiled in 3 ways; first as an area as a whole, which includes the following criteria: Eastview, South Shores, Palisades, Point Fermin, Vista Del Oro, Plaza, Miraleste Pines, Holy Trinity, and San Pedro – North.
Following the total grouping of areas, they are then broken down into groups of three, in order to provide workable averages and medians that maintain some significance. Lastly, the areas will have averages and medians individually, in certain situations and areas we must be aware of outliers due to small number of individual sales and statistical data.
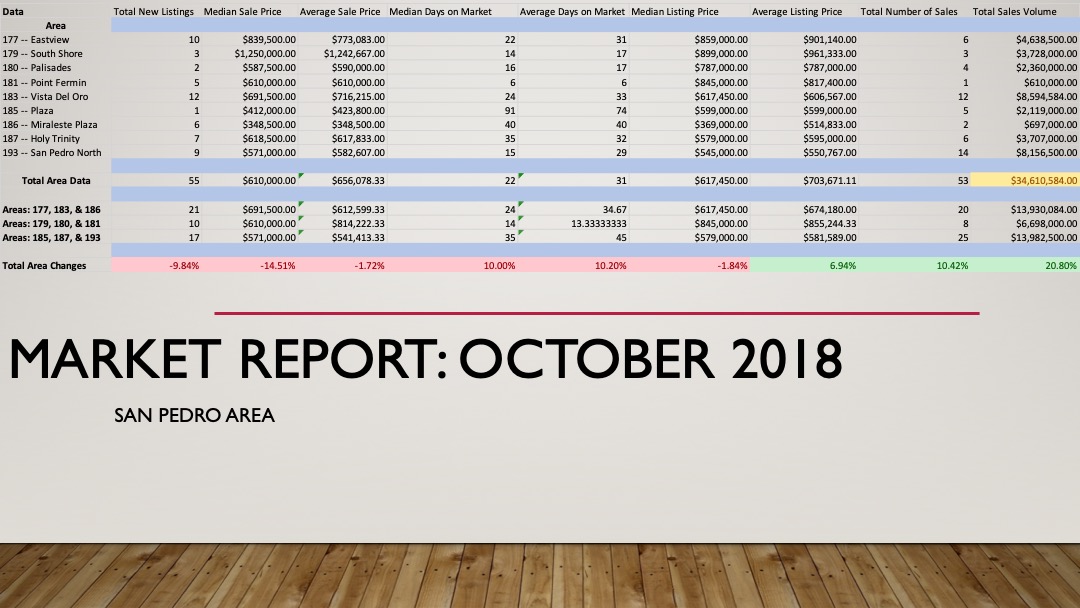
At the end of this post will be a visual breakdown of all statistics and data compiled for the month of October.
Total Area Data
During October, San Pedro saw a total of 55 new listings, which shows a decrease compared to September’s 61, a small decrease of 10.91%. This months median sale price was $610,000.00 while the average was $656,078.33. Both categories were showing decreases of 16.97% and 1.75%.
As we move on into November, October saw 53 homes sell which is a small increase of 9.43% compared to last months 48 home sales. As a note, October was one away from matching August’s total of 54.
The average and median days to sell for a home on the market through the month of October was 22 and 31 days. Respectively, they showed increases compared to September of 10% and 10.20%.
Lastly, one of the new categories included in the Monthly Market Reports is the Total Sales Volume; for the month of October, San Pedro saw a Total Sales Volume of $34,610,584.00 which was a 20.80% increase from the month of September. September’s monthly total previously was $28,641,890.00.
Want to find out what your home is worth? Click the text below!
Area Breakdown
For further quantification of the data, all areas included in this Market Update have been broken down into groups of three based on various factors:
- Eastview, Vista Del Oro, and Miraleste Pines
- South Shores, Palisades, and Point Fermin
- Plaza, Holy Trinity, and San Pedro – North
Group One
As we begin, Eastview, Vista Del Oro, and Miraleste Pines had a total of 21 new listings this month, the largest total of the three groups.
We saw an average sale price in this group of $612,599.33 with a median sale price of $691,500.00. On average, homes in this area, were on the market for a total of 34.67 days with a median of 24.
Upon listing, group one averaged $674,180.00 with a median of $617,450.00. By the end of October, Group One totaled 20 homes sold with a total sales volume of $13,930,084.00
Group Two
South Shores, Palisades, and Point Fermin ended the month with a total of 10 new listings, the smallest of the group of three.
For this group, there was an average sale price of $814,222.33 along with a median of $610,000.00. On average, a home stayed on the market for 13.33 days with a median of 14.
Lastly, upon listing, there was an average price of $855,244.33 with a median of $845,000.00. At the end of October, Group Three boasted 8 homes sold with $6,698,000.00 in Total Sales Volume.
Group Three
Lastly, Group Three, comprised of Plaza, Holy Trinity, and San Pedro-North, ended the month with a total of 17 new listings.
On average, Group Three saw a home sell for $541,413.33 with a median of $571,000.00. On average, homes stayed on the market for 45 days with a median of 35.
On average, homes in these areas listed at $581,589.00 and had a median list price of $579,000.00. By the end of October, Group Three had seen 25 closings, the most of all three areas, with a total sales volume of $13,982,500.00
Visual Representation of Data


Leave a Reply