San Pedro Real Estate Market Update
Market Report for the Month of April 2019
The below will provide market data, obtained from the California Regional Multiple Listings Service, in order to further understand the trends of our current Real Estate Market in San Pedro and the South Bay Community. Data obtained and detailed in this blog is intended to be reliable, but is not guaranteed to be so.
There are 3 ways the data is compiled; first as an area as a whole, which includes the following criteria: Eastview, South Shores, Palisades, Point Fermin, Vista Del Oro, Plaza, Miraleste Pines, Holy Trinity, and San Pedro – North.

Following the total grouping of areas, they are then broken down into groups of three, in order to provide workable averages and medians that maintain some significance. Lastly, the areas will have averages and medians individually, in certain situations and areas we must be aware of outliers due to small number of individual sales and statistical data.
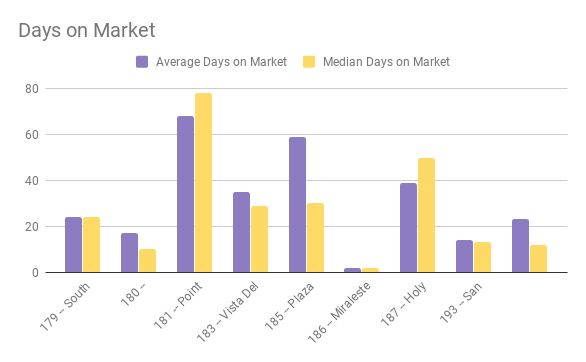
At the end of this post will be a visual breakdown of all statistics and data compiled for the month of April.
Total Area Data
San Pedro is working it’s way through the Spring and we now have some time to take a look back at the month of April and see how it faired for the San Pedro Real Estate Market. To get the ball rolling, San Pedro saw 66 properties become newly listed. Compared to March, which had 59, this was a 11.86% increase.
On Average when a property was listed during the month of April, the price was $684,380.67. On the other hand, properties had a Median Listing Price of $646,649.89 throughout the month. Respectively there was an increase in the average by 0.64% and a decrease in the median of 4.76%.
After transactions had closed, properties had an average sale price of $653,164.11 which showed an increase of 8.14% compared to the month of March. In addition to the average, properties had a median sale price of $631,750.00 which also shared an increase, which was 5.40%.
Lastly, for the month of April, San Pedro saw 37 transactions come to a close. This was a decrease compared to the month of March by 7.50%. These 37 transactions totaled $24,648,228.00 in Real Estate sold. The Total Sales Volume increased by 2.58% compared to the last month.
Area Breakdown
For further quantification of the data, all areas included in this Market Update have been broken down into groups of three based on various factors:
- Eastview, Vista Del Oro, and Miraleste Pines
- South Shores, Palisades, and Point Fermin
- Plaza, Holy Trinity, and San Pedro – North
Area One: Eastview, Vista Del Oro, and Miraleste Pines
To start off, Eastview, Vista Del Oro, and Miraleste Pines tallied 25 new listings for the month, which was the most out of the three groups. This was an increase compared to March’s total of 23 for Group One.
Group One had an Average Listing Price of $677,125.67 while it’s Median Listing Price was $654,299.67. Once the property had sold, it had an Average Sale Price of $618,689.67 and a Median Sale Price of $596,666.67
For the month of April, Group One totaled 14 sales which added up to $9,231,728 in Real Estate Sold. Properties generally stayed on the market for an average of 40.67 Days with a median of 34.67 Days in Group One.
Area Two: South Shores, Palisades, and Point Fermin
In the middle of the pack, South Shores, Palisades, and Point Fermin collectively listed 22 new properties during April, which was the second most out of the three groups. This was a good jump from March which only had 13 new listings.
Listing Prices averaged at $825,778.33 for Group Two while they maintained and a Median Listing Price of $751.983.33 in April. After properties were listed and active on the market, they, on average, sold after 4o days with a median of 8.33.
Lastly, South Shores, Palisades, and Point Fermin saw a total of 13 homes sold, once again the second most, which had a Total Sales Volume of $3,154,333.33.
Area Three: Plaza, Holy Trinity, and San Pedro (North)
Rounding out the month we have the third and final area which includes, Plaza, Holy Trinity and San Pedro (North). These three areas accounted for 19 of the new listings this month, placing third of the three groups. This is a decreases from lasts months’ 23 new listings.
Listing Prices averaged $550,238.00 in Group Three with a Median Listing Price of $533,238.00. After listing, homes stayed on the market for an average of 13 days with a median of 9 days! Wow!
Lastly, Group Three totaled 10 homes sold, trailing behind groups one and two. By the end of April, Group Three had a Total Sales Volume of $1,984,500.00
Find Out Your Home’s Value Today!
Free Home Valuation
Complete the required information about your home and receive a FREE analysis of your homes approximate value on the market today.


Leave a Reply