San Pedro Real Estate Market Update
Market Report for the Month of November, 2018
The below will provide market data, obtained from the California Regional Multiple Listings Service, in order to further understand the trends of our current Real Estate Market in San Pedro and the South Bay Community. Data that has been obtained and detailed is intended to be reliable, but is not guaranteed to be so.
Data has been compiled in 3 ways; first as an area as a whole, which includes the following criteria: Eastview, South Shores, Palisades, Point Fermin, Vista Del Oro, Plaza, Miraleste Pines, Holy Trinity, and San Pedro –
North.
Following the total grouping of areas, they are then broken down into groups of three, in order to provide workable averages and medians that maintain some significance. Lastly, the areas will have averages and medians individually, in certain situations and areas we must be aware of outliers due to small number of individual sales and statistical data.
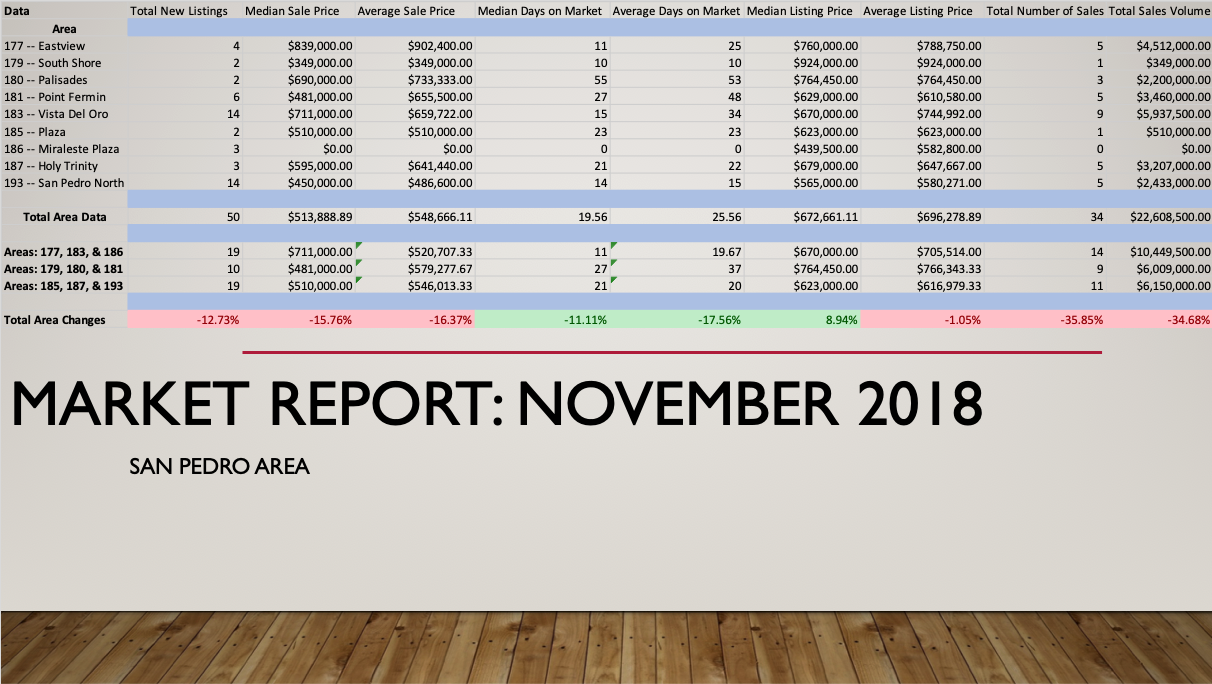
At the end of this post will be a visual breakdown of all statistics and data compiled for the month of November.
Total Area Data
To start, during the month of November, San Pedro saw a total of 50 new listings hit the market; compared to the month of October, there was a decrease of 12.73%. Last month, there were a total of 55 new listings. As a reminder, the month of September boasted 61 new listings. That being said, it seems as though we are seeing the market slowing for inventory.
November’s median sale price was $513,888.89 while the total average for the month was $548,666.11. In comparison to the month of October, respectively, these are both decreases of 15.76% and 16.37%.
On average a residential home stayed on the market for about 25.56 days prior to close, with an averaged median of 19.56 days. When compared to the month of October, homes sold quicker with percentage changes of 11.11% and 17.56%.
Furthermore, new residential property was listed at $696,278.89 on average. The newly listed homes had a median price-tag of $672.661.11. Median listing price rose by 8.94% this month with the monthly average having decreased by 1.05%.
Curious as to what your home is worth? Click the text below!
Area Breakdown
For further quantification of the data, all areas included in this Market Update have been broken down into groups of three based on various factors:
- Eastview, Vista Del Oro, and Miraleste Pines
- South Shores, Palisades, and Point Fermin
- Plaza, Holy Trinity, and San Pedro – North
Group One
To start, we will be looking at the details for Eastview, Vista Del Oro, and Miraleste Pines. These three areas had a total of 19 new listings which is a small decrease from October’s 21.
Group One saw an average sale price of $520,707.33 with an averaged median of $711,000.00. On average for a home in this group, it was on the market for 19.67 days with a median of 11.
When listed, a property averaged a price tag of $705,514.00 with a median of $670,000.00. By the end of the month, Eastview, Vista Del Oro, and Miraleste Pines had 14 total closings producing $10,449,500 in total sales.
Group Two
Moving on we have South Shores, Palisades, and Point Fermin; by the end of November these three areas brought 10 new listings to the market. Looking back to October, it matched productivity, also having 10.
Group two averaged a sale price of $579,277.67 with a median of $481,000.00. On average, it took 37 days for a property to sell with a median of 27.
The average listing price for these three areas was $766,343.33 with a median of $764,450.00. At the end of the month South Shores, Palisades, and Point Fermin saw 9 closings with a total sales volume of $6,009,000.00.
Group Three
Rounding out the groups we have Plaza, Holy Trinity, and San Pedro – North who ended the month with 19 new listings, matching Group One.
The average sale price for this group was $546,013.33 with a median of $510,000.00 accompanied by taking an average of 20 days to sell and a median of 21 days.
When coming on to the market, new property in the area was listed with an average price of $616,979.33 and a median price of $623,000.00. These areas had a total sales volume of $6,150,000 comprised of 11 closings throughout the month of November.
Some Afterthoughts:
It certainly is the Winter Season for the Real Estate Market at the current moment; we can see some softening in prices. In addition to that, though some of the data speaks differently, certain properties are staying on the market a little while longer than what the market was used to 6 months ago.
We certainly are also seeing fewer home being purchases as the total sales volume has decreased substantially over the last three months; previous totals are available in our older blog posts.
Visual Representation of Data


Leave a Reply