San Pedro Real Estate Market Update
Market Report for the Month of September 2019
As I stated in a blog a few months ago, the Market Update is always looking to be improved. This is month, I made a change in a way in which data is gathered. Moving forward there will be separate data for Single Family Residence, Condominiums, and Townhomes. SFR will have their own data and the remaining two will be grouped together.
The reason for this change was that Single Family Residences, in contrast with Condominiums and Townhomes, generally have a large discrepancy in price. When grouped together the data may have been skewed by these price differences; with the property types split I hope for more accurate averages for sales and areas.
With that said, in this month’s blog we will not be comparing the month to month percentage change due to the new categories. That piece of data will return at the end of October when we have two months worth of data. But for now, let’s move on to Septembers numbers!
Total Area Data (SFR):
For the month of November San Pedro recorded 24 New Listings, which was a decrease compared to October, of 33%. During this month, the average listing price for a single family home was $739,070 along with a median listing price of $754,000. Compared to last month these were respective increases of 3.91% and 0.20%. Single Family
Homes, on average, took 48 days to sell with a median of 23 days. This was an increase of 20% longer and the median exhibiting no change as compared to the month of October. Once sold, there was an average sale price of $816,522 and a median of $752,500. Both showing increases of 9.01% and 8.12%.
Lastly, San Pedro totaled 22 home sales through the month of November, which was a decrease of 24.14% as compared to October. The total sales volume for November came out to $17,963,492, which was also decreased by 17.30%.
Area Breakdown
For further quantification of the data, all areas included in this Market Update have been broken down into groups of three based on various factors:
- Eastview, Vista Del Oro, and Miraleste Pines
- South Shores, Palisades, and Point Fermin
- Plaza, Holy Trinity, and San Pedro – North
Area One: Eastview, Vista Del Oro, and Miraleste Pines (SFR)
Group One, consisting of Eastview, Vista Del Oro, and Miraleste Pines accounted for 12 of the 24 listings this month. Listings in these areas had starting prices of $798,825 with a median listing price of $785,000. Homes around these neighborhoods spent on average 61 days on the market with a median of 63 days. Once sold, properties had an average sale price of $855,100 and a median sales price of $825,000. Lastly, this grouping totaled 5 sales through the month of November with a total sales volume of $4,275,500.
Area Two: South Shores, Palisades, and Point Fermin
Rounding the bend are South Shores, Palisades, and Point Fermin, whom tallied 6 new listings through the days of November. Homes in this grouping averaged a listing price of $895,983 with a median listing price of $872,000. Once on the market, they would remain there for an average of 35 days with a median of 14 days. The average sales price in these areas was $880,800 with a median sales price of $749,500. Lastly, South Shores, Palisades, and Point Fermin accounted for 10 total sales through the month of November adding up to $8,808,000 in total sales volume.
Area Three: Plaza, Holy Trinity, and San Pedro (North)
Last up to bat is Plaza, Holy Trinity, and San Pedro (North); these neighborhoods would bring in 6 new listings as well to the market during the month of November. Homes in these areas had an average listing price of $678,648 and a median listing price of $724,995. The average amount of time spent on the market was 57 days along with the median of 24 days. Once sold, the average sales price in these areas was $697,142 with a median sales price of $694,000. Last but not least, Plaza, Holy Trinity, and San Pedro (North) combined for 7 total sales worth $4,879,992 in total sales volume.
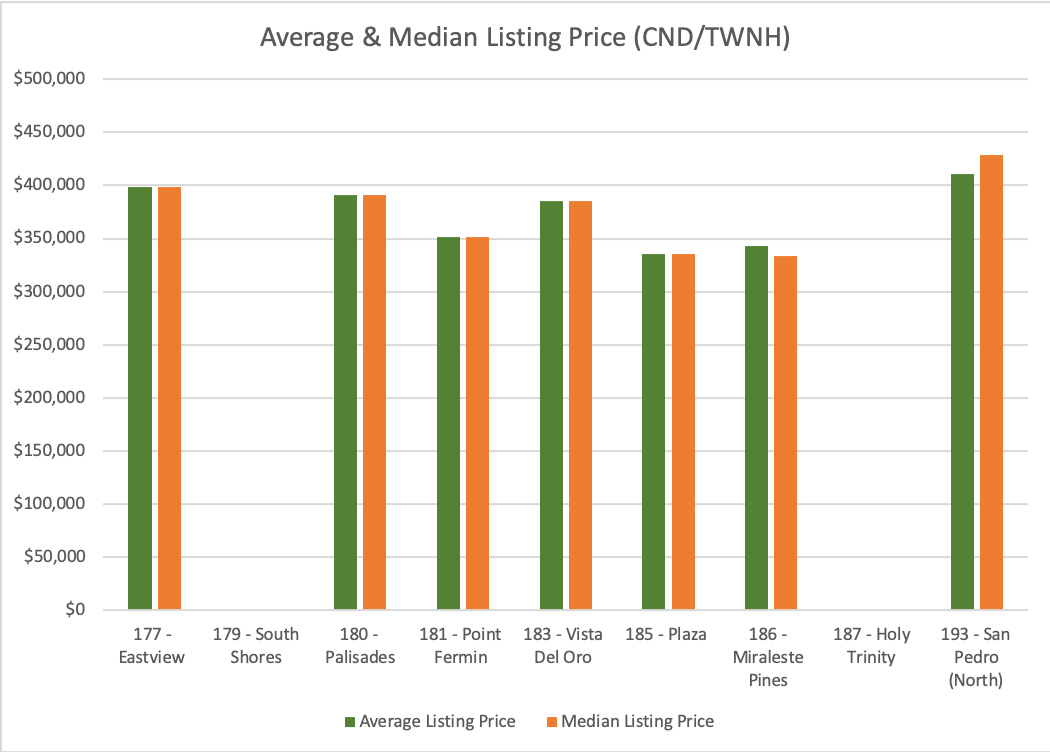
Total Area Data (Condominium / Townhome):
Moving on towards Condominiums and Townhomes, San Pedro saw 15 new listings during the month of November which was a decrease of 25% as compared to last month. The average listing price for these properties was $379,353 with a median of $378,000. Both decreases of 21.07% and 22.70% respectively.
Once put on the market, these properties would remain there for an average of 26 days, with a median of 12, until they sold. These catagories both showing increases of 33.33% and 14.29%. The average sales price for Condominiums and Townhomes was $433,188 and $407,000 with decreases of 10.99% and 12.85%.
Lastly, through the month of November, San Pedro saw 8 total sales totaling $3,465,500 in real estate sold.
In order to keep this blog from running too long, below is a condensed version of the Area Breakdown for Condominiums and Townhomes.
Area One: Eastview, Vista Del Oro, and Miraleste Pines CND/TWNHM
- 5 New Listings
- Average Listing Price – $362,580
- Average Days on Market – 57
- Average Sale Price – $369,750
- Total Sales – 2
- Volume – $739,500
Area Two: South Shores, Palisades, and Point Fermin
- 4 New Listings
- Average Listing Price – $371,375
- Average Days on Market – 25
- Average Sales Price – $489,667
- Total Sales – 3
- Volume – $1,469,000
Area Three: Plaza, Holy, Trinity, and San Pedro (North)
- 6 New Listings
- Average Listing Price – $398,650
- Average Days on Market – 6
- Average Sale Price – $419,000
- Total Sales – 3
- Volume – $1,257,000


Leave a Reply